DevRel Analytics: Bridging the Gaps and Filling in the Missing Pieces
As a DevRel Engineer, building a strong community around your open source product is essential. However, it can be difficult to truly understand the impact of your outreach efforts on your product's success. That's where the relationship between community metrics and product metrics comes in.
To kick off this DevLog series, I'd like to share a quote that's close to my heart:
“If we have data, let's look at data. If all we have are opinions, let's go with mine.” – James Barksdale, former CEO of Netscape
Without further ado, let's dive into it.
The Problem with DevRel Platforms
As someone who has been in the trenches of DevRel (and still is), I know firsthand how frustrating it can be to have to check multiple platforms to get a complete picture of the current state of affairs when it comes to metrics. Heck, even if you just want to see your GitHub stars growth overtime, you need to use a third-party service like GitHub Star History.
Even if you manage to setup a workflow that let's you have an overview of all the metrics that tie to your efforts, there's no central hub where you can easily identify what kind of activities made the biggest impact on your product's metrics.
Now, I understand that a 100% accurate correlation between DevRel activities and product metrics might be very difficult to achieve but getting some rough pointers is more than helpful to promote data-driven decision making.
Here is an example of a case where an article was released at the right time with the right subject, causing an increase in the amount of users we have:

Correlation between a successful blog post and a higher conversion rate.
That's one example out of many. The efforts of a DevRel individual/team not only increase the conversion rate, but can also have a positive impact on retention and other key metrics. Here is a table that maps various DevRel activities to their potential impact on product metrics:
| Conversion | Retention | |
|---|---|---|
| Content Creation | ✓ | ✓ |
| Docs Updates | ✓ | |
| Conferences/Meetups | ✓ | |
| Community | ✓ | |
| Feedback Gathering | ✓ | |
| Events Organization | ✓ |
Since there were no solutions on the market that would help me get rid of my frustrations, I've decided to try and solve it on my own in a hacky way. I came up with this Frankenstein of a solution shuttle that I created alongside with our Engineering team. As you'll see in the napkin-diagram below, we've created a solution that consolidates data from various platforms into one place. This helps me to connect the dots between DevRel efforts and product metrics, enabling better analysis and optimization of outreach activities.

The 🪄Magic🪄 part you see in the diagram is the part where we take all the raw data that's fed into the system and do our own custom calculations that produce our end-goal metrics, for example:
- Churn – users with a last activity that happened > 30 days ago, displayed in the form of a table & graph in Looker
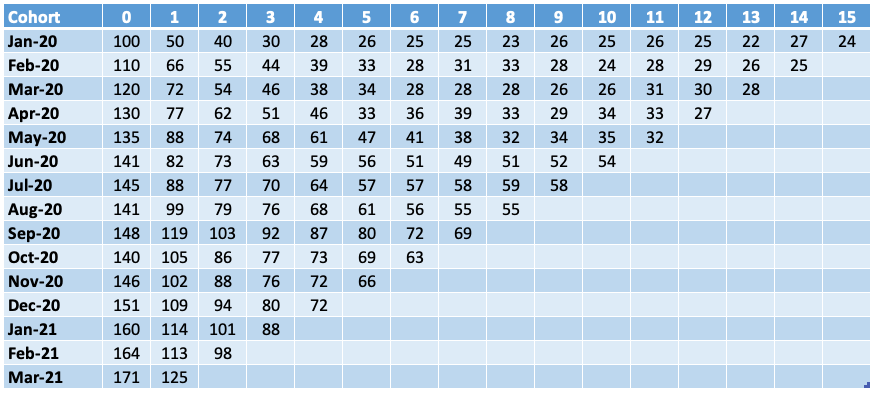
- Retention – users which had multiple interactions with our product over a period of time, displayed as a cohort table in Looker
- .. and so on
It's clear that the current solution is not a sustainable approach in the long term, and it also brings its own set of complications. Therefore, it's imperative that a change is made and we look towards a brighter future.
The Brighter Future
After recognizing the limitations of the current approach, Ian and I set out to create a solution that would enable DevRel teams to effortlessly track their outreach efforts and gain valuable insights into how their actions are impacting their open source products.
Guided by the Frankenstein solution, which works but isn't sustainable, we've decided to split the undertaking of creating the first analytics platform for DevRels into two parts:
- Part 1 a dashboard that encompasses all your community-related metrics in one place (eg. Twitter, GitHub, YouTube, Dev.to, Website, etc) ─ automating the right side of the diagram
- Part 2 a dashboard that bridges the gap between community & product metrics, allowing for easy pattern recognition and connecting the dots ─ bringing it all together
The platform will, for starters, offer a detailed overview of GitHub, Discord and Twitter metrics, with the usual suspects when it comes to data visualization, such as setting custom date ranges and filtering the data. From there, we will expand towards supporting different sources and making it easy for everyone to plug-in their own. And the rest....? We'll figure out as we go, what could go wrong, amirite?

We will share our journey of building this tool in this DevLog blog post series, discussing the challenges we face, the decisions we make, and the lessons we learn along the way.
There are two main goals that we want to achieve:
Making it dead-easy to understand the effects DevRel activities have on the success of a product by providing clear, easy-to-understand insights into the impact of DevRel activities on a product's success, meaning that you won't have to spend hours poring over data to make sense of it all. Instead, you should be able to quickly see how your outreach efforts are contributing to your product's growth.
Provide the ability to measure ROI of DevRel efforts in an open source setting by having access to a platform that measures a variety of factors that impact a product's bottom line. This includes things like the effect of those efforts to, for example, retention & conversion rates. By tracking these metrics, you should be able to see how your efforts are impacting the overall success of your product and make data-driven decisions accordingly.
*smacks lips* Noice.
Formalities and walls-of-text out of the way; everyone knows that the most important step when building a product is to spend countless hours fine-tuning your visual identity, without even having written a single line of code so here you go, this is what we imagine our brand to look like:

Stay tuned for our next DevLog post!