Celebrate 200 Years of Singapore law with pretty graphs

Apparently it’s one year late, but there’s a new article on the Singapore Academy of Law Journal titled “ The Development of Singapore Law: A Bicentennial Retrospective “. It celebrates the autochthonous development of law in Singapore. I am not so interested in that — I was looking forward to the pretty data visuals which the authors used to illustrate their points.
Pretty Graphs for everyone
The article has the look and feel of a grand project. Lawyers and law academics are great at expressing themselves with words. You will find a gigantic 87-page long article with an upbeat and celebratory tone.
Thus, I was pleasantly surprised that the article contains some of the best data visualisations I have seen in an article about law. When you get to it of course. (If you are a fan of data visualisations like me, check out FiveThirtyEight’s yearly feature)
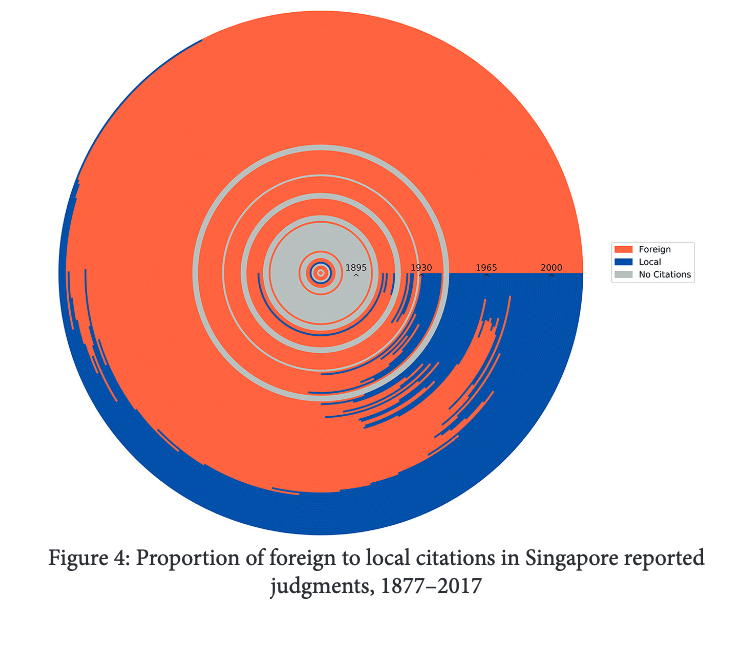
Here’s one of my favourite graphs:
 Phang Goh and Soh “THE DEVELOPMENT OF SINGAPORE LAW: A BICENTENNIAL RETROSPECTIVE” at paragraph 62/page 32.
This graph shows the proportion of foreign and local cases cited in each year. As you can see from the outer rings, the proportion of local cases being cited to the Court have increased. I wished they chose a different colour combination, but it’s still gorgeous.
Here’s a list of interesting graphs you can check out in the article:
- A stacked bar graph showing an explosion of cases cited to the supreme courts in Singapore (paragraph 56)
- A line graph showing the increasing trend of longer reported cases in Singapore (paragraph 60).
- A heatmap showing the increasing number of Singapore cases cited in foreign jurisdictions (Paragraph 75)
If you are aware of the Supreme Court’s work, the article’s conclusions on the development of Singapore law are not surprising. However, having these conclusions quantitatively assessed and described in graphs is a great bonus!
Data collection methodology
If you are reading the article, don’t miss Appendix A (it is right after the ‘Concluding Thoughts’). It describes the data collection methods and practices the authors used to produce the visuals in the article. Given the rarity of computational law articles in Singapore, this is probably the first time many lawyers will find out how data is collected for a project like this.
Fun fact: the article states that Python regular expressions were used to extract citations from the judgement text. I guess (and this is the one I used for extracting my projects) is:
([\d{4}])\s+((?:\d\s+)?[A-Z|()]+)\s+[?(\d+)]?
Even though the article is very long, the methodology of how the data was collected for this project is short. If you are very interested, you should refer to one of the author’s earlier work. It’s less ambitious but contains much more detail on how it was done.
Concluding thoughts
The authors state that all information for post-independent reports “were readily machine-extracted from the data structure of the HTML judgments we were authorised to download from LawNet”. Given the trouble I am having splicing PDF files now, I am pretty jealous they could just pull out the information from tags. I have never asked LawNet for permission to mass-download judgements, since I am opposed to the idea for asking for permission for data that should be in the public domain. This just goes to show how inaccessible legal data is in Singapore.
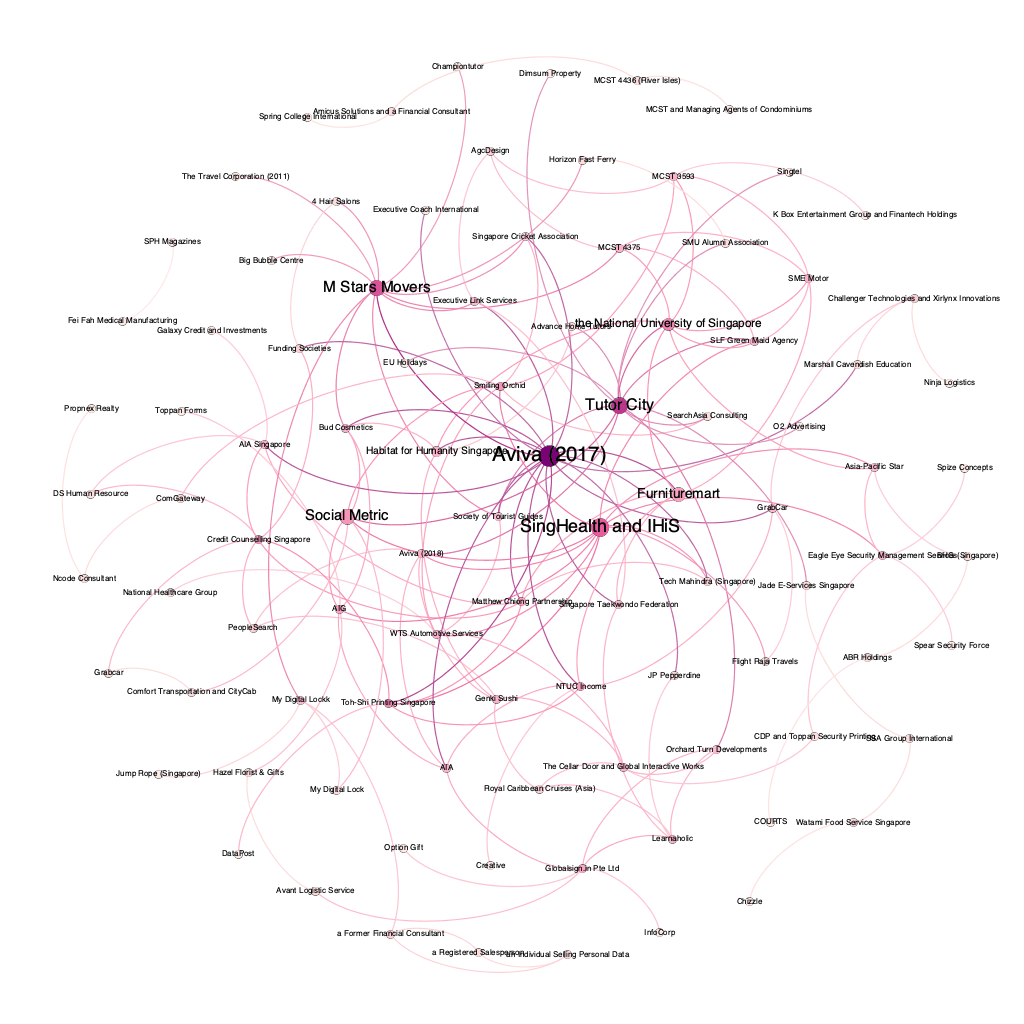
Anyway, I am going to be happy with what I can get. Here’s a previous graph I made from my data. It looks pretty to me too!
 It’s pink. What more can I say?
With the publication of such articles, I hope that there is more place for computation analytics in the legal domain. What do you think?
Love.Law.Robots. – A blog by Ang Hou Fu
- Discuss... this Post
- If you found this post useful, or like my work, a tip is always appreciated:
- Follow [this blog on the Fediverse]()
- Contact me:
