Presenting: The PDPC Decision Star Map (Version 2)
This post is part of a series on my Data Science journey with PDPC Decisions. Check it out for more posts on visualisations, natural languge processing, data extraction and processing!
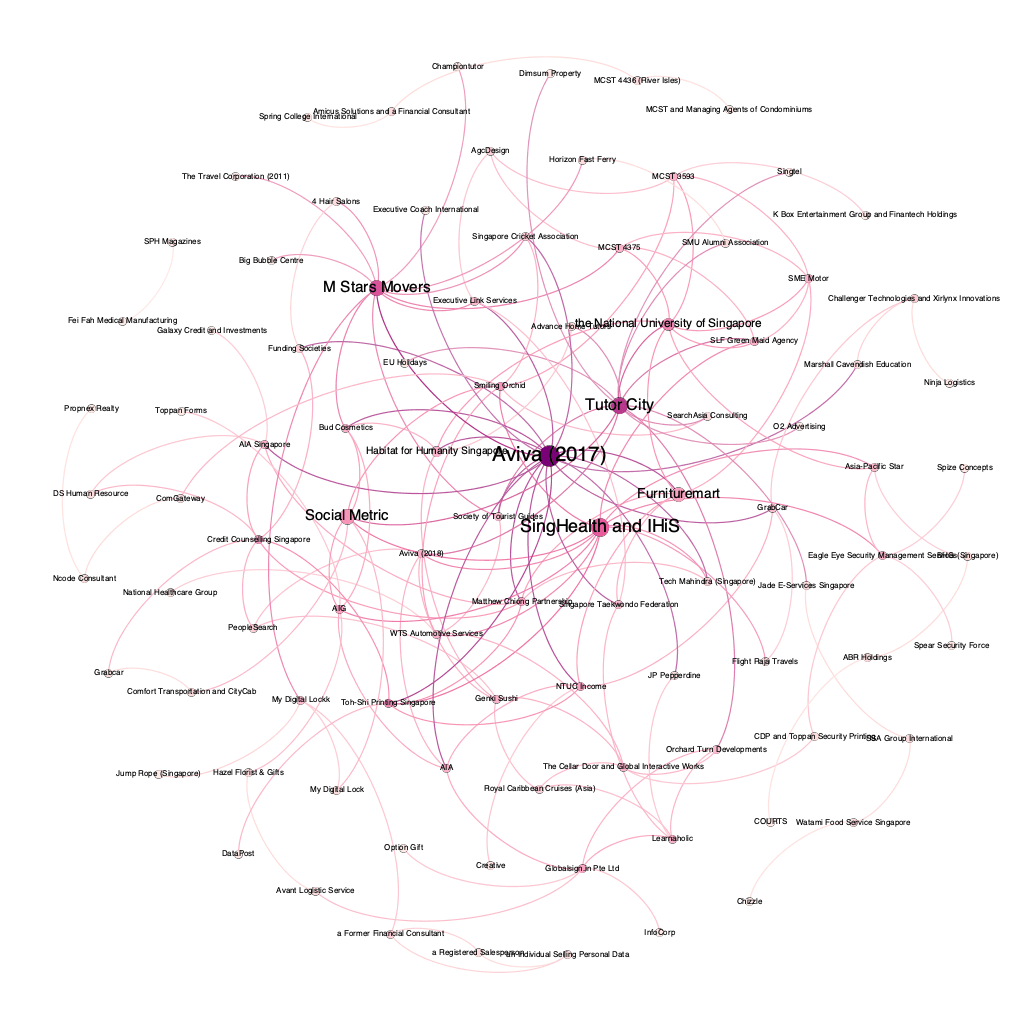
Networks are one of the most straightforward ways to analyse judgements and cases. We can establish relationships between cases and transform them into data. Computers crunch data. Computers produce a beautiful graph. Now I have the latest iteration of the network data of the Personal Data Protection Commission of Singapore’s decisions. I call it a star map , because it looks like a constellation, and it shows us the “stars” of the universe of PDPC decisions.

Making the star map
One of the earliest features of the pdpc-decision is to grab citations and make a table of which decisions cite which decisions. In the broadest sense of the word, the automated process works. Running a regular expression search on a document is going to find citations. Except when the citations do not follow that format. I had to go through each decision to check its accuracy.
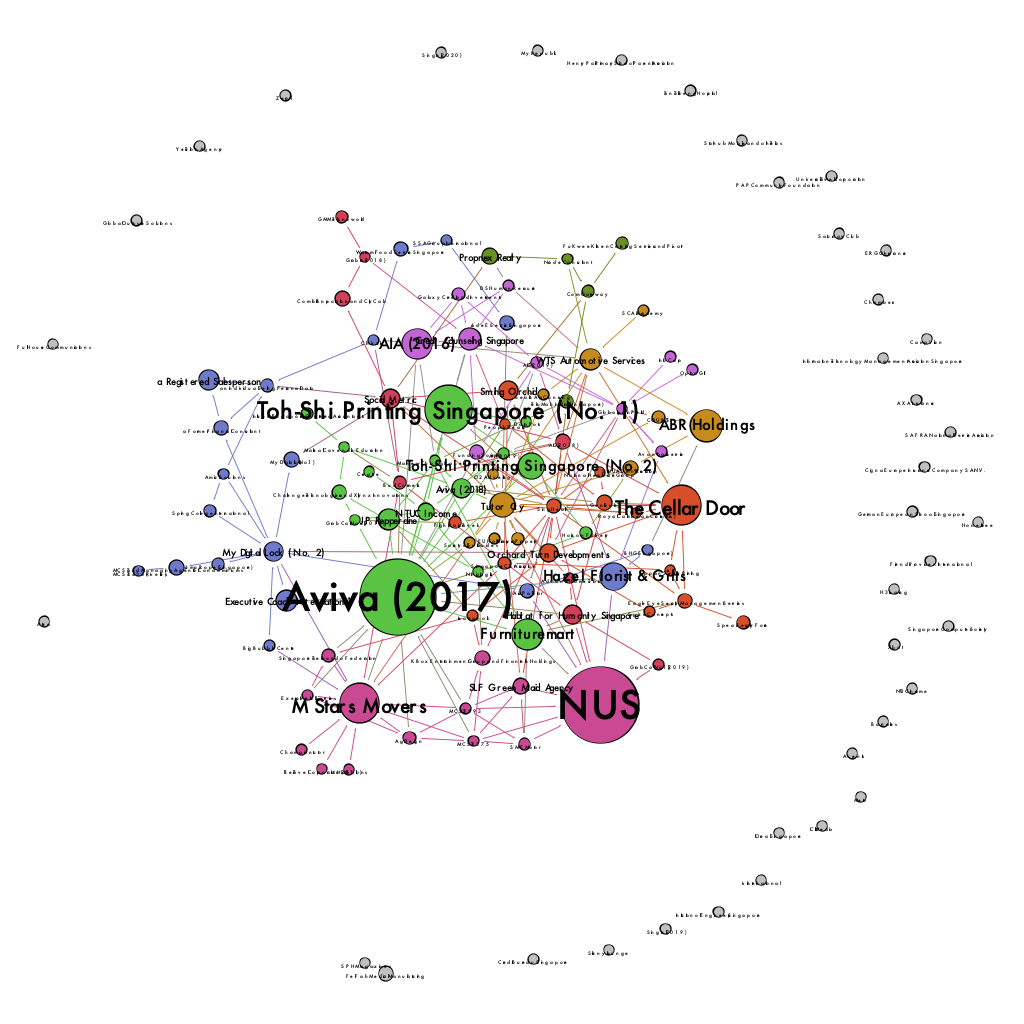
Notwithstanding, the first version of the star map was produced fairly quickly.
 The first version of the star map.
Here are the biggest difference between the first version and the second version:
- The data is directed instead of undirected. As such, the information now knows that Case A cites Case B. Previously it only knew that Case A is connected to Case B.
- PageRank determined the size of the nodes and labels. In short, PageRank determines how likely a decision will be visited when following citations randomly. It is very similar to how search engines work. The nodes in the previous version were sized based on the number of connections it enjoyed.
I also tweaked the visualisation so that it looks more appealing. You can see now that there are many cases which don’t cite any decision. Out of curiosity, I asked the computer to partition the nodes and edges; the colours of the nodes and edges show what the computer thinks are distinct groups of decision.
I used Gephi from start to end. The pdpc-decision package produces information on relationships in a CSV format. I then imported the CSV into Gephi. During the sight checking of decisions, I would make any revisions directly in Gephi (there were about 1-3 fixes overall). Gephi was then used to produce the visualisation you would see as the final product.
How effective is the star map?
PageRank makes a difference
As a result of using directed references and PageRank, you can see some subtle differences between the two versions of the star map. Some decisions (nodes) have changed their size as a result of applying a different metric.
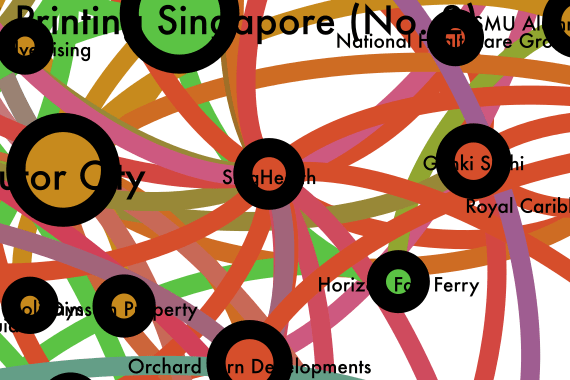
If you can’t see it (and I don’t blame you), you can look for the mammoth Singhealth decision. Singhealth was one of the largest nodes in version 1 but seems to have disappeared in the new version. (It’s actually between Tutor City and Genki Sushi in the orange zone.)
 Location of SingHealth decision on the star map.
The connected metric, which only counts how many connections are made, made SingHealth pretty large because it cites several cases, and some cases cite it. This isn’t the whole picture though. An analogy helps to explain better. You might have a friend that name drops all the important people they know, but nobody else important knows him. It is part of my case that SingHealth was an outlier — it might have cited several decisions as a basis of its decision, but few decisions thereafter have cited it.
Changing the metric does not remove all biases. The top decisions — Aviva 2017, NUS, Toh Shi Printing Singapore, M Star Movers and the Cellar Door were all published in 2016 and the early part of 2017. This isn’t exactly unexpected. Older decisions have more time to accumulate citations. Ceteris paribus , an older decision is more likely to be cited than a newer one.
Looking at Citations is still useful
One should not overstate the power of citations in PDPC decisions. Unlike Court judgements, the PDPC does not have to justify their reasoning by reference to previous cases. Ergo, PDPC decisions are non-binding. This confusion leads to some respondents trying to “distinguish” their case by referring to previous cases.
Once we understand that the PDPC’s use of citations is purely voluntary, the PDPC would make a citation when the PDPC thinks that the decision helps to explain its own decisions. The most significant nodes in the map relate to a series of decisions that cite several previous decisions and also cite information and practices from other jurisdictions like the UK, Canada and Hong Kong. These include M Star Movers, Aviva (2017), NUS, Orchard Turn and Social Metric.
While also focusing on the size and the density of its connections, the node’s position in the map is also useful. The general position of the nodes is not random. The closer the node is to the centre, the more likely is that the node is a hub. As such, besides SingHealth, Tutor City in 2019 received quite a lot of focus as well.
Being able to visualise the relationships between decisions in a network map helps us to understand the whole landscape of decisions in aggregate. The larger nodes represent important decisions. The nodes near the centre represent hubs. We can now summarise the landscape of decisions.
Next steps
This work tries to answer a practical question. If I only have enough time to read a few PDPC decisions, which decisions should I read? Of course, there is room for professional judgement or opinion. However, we should not ignore a computational method too. Arguably it’s more objective as well. Hopefully, I get around to creating a document using such research.
Having allowed this project to go over a few iterations also allowed me to understand its limitations. The use of decisions is far too narrow in this case because a lot of interesting information can also be found in the Commission’s guidelines. This is not captured in studying how decisions cite each other.
However, the obstacle to implementing this was actually architectural. As the structure was created for decisions , its data structures can’t accommodate other reference materials. A date of publication or complaint isn’t present in a guideline. The code needs to be rewritten, possibly in a graph database.
Urrgh, the project never ends.
#PDPC-Decisions
Love.Law.Robots. – A blog by Ang Hou Fu
- Discuss... this Post
- If you found this post useful, or like my work, a tip is always appreciated:
- Follow [this blog on the Fediverse]()
- Contact me:
